Welcome to our Equilibrium Price and Quantity Calculator! This powerful tool allows you to delve into the fascinating world of economics by finding the equilibrium point in a market. Discover the magic intersection where supply meets demand, determining the perfect price and quantity for any product or service. Whether you’re a student, business owner, or simply curious about market dynamics, our calculator simplifies the complex concepts of economic equilibrium. Explore this webpage to gain insights into pricing strategies, production planning, and market trends, all at your fingertips.
What is an Equilibrium Price and Quantity Calculator?
An Equilibrium Price and Quantity Calculator is a tool or software application used in economics to determine the equilibrium price and quantity of a product or service in a market. It helps in analyzing the supply and demand dynamics to find the point where the quantity demanded equals the quantity supplied, resulting in a balanced market.
Here’s how it typically works:
- User Input: The calculator takes input from the user regarding the demand and supply functions for a particular product or service. These functions usually depend on the price of the item.
- Equilibrium Calculation: Using the input provided, the calculator uses mathematical equations to find the equilibrium price (P) at which the quantity demanded (Qd) equals the quantity supplied (Qs). This equilibrium price represents the market-clearing price, where there are no surpluses or shortages.
- Display Results: The calculator then displays the equilibrium price and quantity to the user, giving insights into the market’s current state.
- Analysis: Users can use the results to make economic predictions, understand market behavior, and assess the impact of various factors on supply and demand.
Equilibrium Price and Quantity Calculators are commonly used in economics, finance, and business analysis to make informed decisions, such as pricing strategies, production planning, and understanding market trends. They are particularly useful when dealing with linear supply and demand functions, as demonstrated in your previous examples.
The Formula for Equilibrium Price and Quantity Calculation
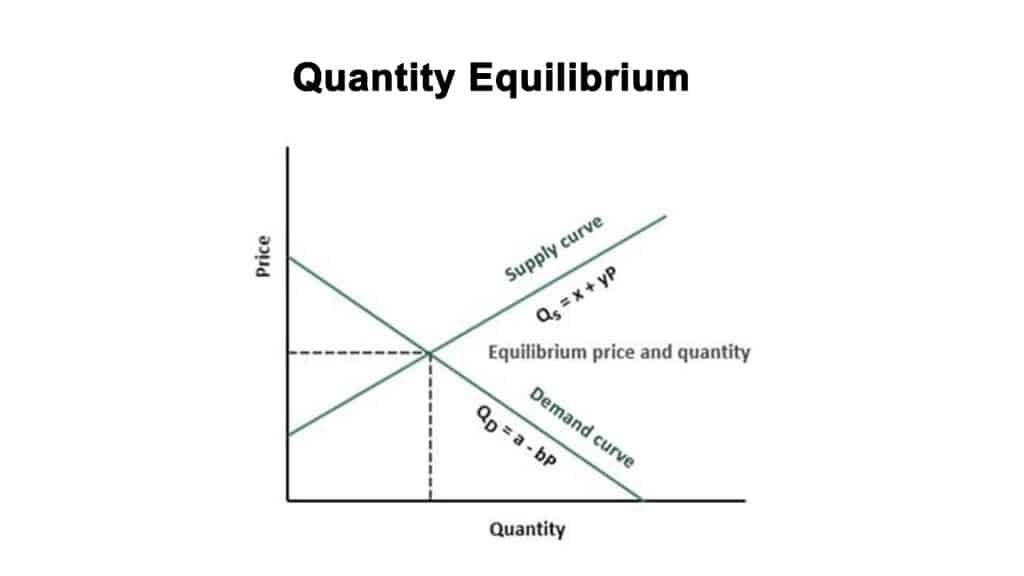
The formula for calculating equilibrium price and quantity in economics relies on the intersection of the demand and supply functions. In a simplified linear form, the equations for quantity demanded (Qd) and quantity supplied (Qs) are as follows:
- Quantity Demanded (Qd): Qd = a + bP
- Qd represents the quantity demanded.
- ‘a’ is the intercept of the demand curve (the quantity demanded when the price is zero).
- ‘b’ is the slope of the demand curve (indicating how much quantity demanded changes with each unit change in price).
- ‘P’ is the price of the product.
- Quantity Supplied (Qs): Qs = c + dP
- Qs represents the quantity supplied.
- ‘c’ is the intercept of the supply curve (the quantity supplied when the price is zero).
- ‘d’ is the slope of the supply curve (indicating how much quantity supplied changes with each unit change in price).
- ‘P’ is the price of the product.
To find the equilibrium price (P*) and quantity (Q*) where supply equals demand, you set Qd equal to Qs:
a + bP* = c + dP*
To solve for P*, you can rearrange the equation:
a + bP* – dP* = c
Then, factor out P*:
P*(b – d) = c – a
Finally, solve for P*:
P* = (c – a) / (b – d)
Once you have calculated the equilibrium price (P*), you can plug it back into either the demand or supply function to find the equilibrium quantity (Q*):
Q* = a + bP*
or
Q* = c + dP*
These formulas allow you to determine the price and quantity at which the market is in equilibrium, meaning that the quantity demanded equals the quantity supplied, and there are no surpluses or shortages.
Example of Equilibrium Price and Quantity
Let’s consider a simple example of equilibrium price and quantity for a fictional product: “Widgets.” In this example, we’ll use linear demand and supply functions to find the equilibrium.
Demand Function (Quantity Demanded – Qd):
Qd = 100 – 2P
- Qd represents the quantity demanded.
- P represents the price of widgets.
Supply Function (Quantity Supplied – Qs):
Qs = 20 + 3P
- Qs represents the quantity supplied.
- P represents the price of widgets.
Now, let’s find the equilibrium price (P*) and quantity (Q*) by setting Qd equal to Qs:
100 – 2P* = 20 + 3P*
To solve for P*, we can rearrange the equation:
100 – 20 = 2P* + 3P*
80 = 5P*
Now, divide both sides by 5 to isolate P*:
P* = 80 / 5 P* = 16
So, the equilibrium price (P*) for widgets is $16.
To find the equilibrium quantity (Q*), we can use either the demand or supply function, as they should give the same result at equilibrium. We’ll use the demand function:
Qd = 100 – 2P*
Qd = 100 – 2(16) Qd = 100 – 32 Qd = 68
So, the equilibrium quantity (Q*) for widgets is 68 units.
Therefore, in this example, the equilibrium price for widgets is $16, and the equilibrium quantity is 68 units. At this price, buyers are willing to purchase 68 widgets, and sellers are willing to supply 68 widgets, resulting in a balanced market with no surpluses or shortages.
How does this Equilibrium Price and Quantity Calculator work?
This Equilibrium Price and Quantity Calculator is a tool that helps you understand and find the balance between supply and demand in an economic market. Imagine you’re trying to buy or sell a product in a market, and you want to know the price and quantity at which everything is in balance. This calculator does just that.
Here’s how it works in simple terms:
- Input Your Data: You start by entering some information into the calculator. You tell it how the quantity demanded (how much people want to buy) changes with the price of the product. You also tell it how the quantity supplied (how much is available to sell) changes with the price.
- Click “Calculate”: After you’ve provided this information, you click the “Calculate” button.
- Results: The calculator then figures out the price (P) at which the quantity demanded is exactly the same as the quantity supplied. This is the equilibrium price. It also tells you how much of the product will be bought and sold at this price – this is the equilibrium quantity.
- Understanding the Market: These results are important because they tell you about the state of the market. If the price is too high, people won’t buy much, and there might be a surplus. If the price is too low, people will want to buy a lot, and there might be a shortage. But when the price is just right (the equilibrium price), everything works smoothly – supply and demand are balanced.
- Make Informed Decisions: People in business, economics, or even everyday life use this information to make decisions. For example, a company might use this to set the right price for a product, ensuring they can sell everything they produce. Or, a consumer might use it to decide when to buy something at the best price.
So, this calculator takes the complicated idea of supply and demand and makes it easier for people to understand by giving them the price and quantity where things are in balance.
What is price and quantity equilibrium?
In economics, both price equilibrium and quantity equilibrium are important concepts related to market dynamics:
Price Equilibrium (Equilibrium Price):

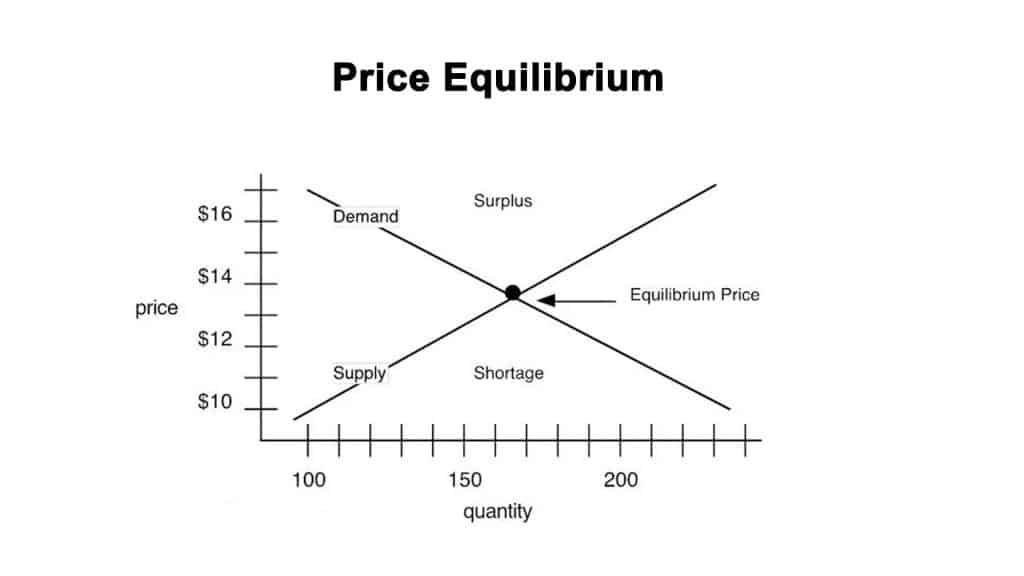
- Definition: Price equilibrium, often referred to as the equilibrium price (P*), is the price at which the quantity demanded (Qd) equals the quantity supplied (Qs) in a market. It’s the point where the supply and demand curves intersect, and there are no surpluses or shortages of a product.
- Significance: Price equilibrium is a critical point in a market because it represents the “fair” or “market-clearing” price. It’s the price at which buyers are willing to buy exactly the same amount of a product that sellers are willing to sell. Any deviation from this price leads to market forces pushing prices back towards equilibrium.
Quantity Equilibrium (Equilibrium Quantity):

- Definition: Quantity equilibrium, also known as the equilibrium quantity (Q*), is the quantity of a product that will be bought and sold in the market at the equilibrium price (P*). It’s the quantity where supply and demand are in balance, and there are no surpluses or shortages.
- Significance: Quantity equilibrium is important because it tells us how much of the product will be exchanged in the market at the market-clearing price. It indicates the level of production and consumption that occurs when the market operates efficiently.
In summary, price equilibrium is the price at which supply and demand are in balance, while quantity equilibrium is the quantity bought and sold at that price. These two concepts together describe a state in which a market operates smoothly with neither an excess supply nor an excess demand for the product. Price and quantity equilibrium are fundamental concepts in economics, used to understand market behavior, make pricing decisions, and analyze the impact of various factors on supply and demand.
What is the relation between Price and Quantity, and supply and demand at Equilibrium?
The relationship between price, quantity, supply, and demand at equilibrium is a fundamental concept in economics. At equilibrium, the price and quantity are determined by the interaction of supply and demand in a market. Here’s how they are related:
Price and Quantity at Equilibrium:
- Equilibrium Price (P)**: This is the price at which the quantity demanded (Qd) equals the quantity supplied (Qs) in a market. It’s the price where buyers are willing to buy exactly the same amount of a product that sellers are willing to sell. Mathematically, P is the price where Qd = Qs.
- *Equilibrium Quantity (Q)**: This is the quantity of the product that will be bought and sold in the market at the equilibrium price. It’s the point where supply and demand are in balance, and there are no surpluses or shortages.
Supply and Demand:
- Demand: The demand curve represents the relationship between the price of a product and the quantity consumers are willing to buy. Generally, as the price decreases, the quantity demanded increases (law of demand), and as the price increases, the quantity demanded decreases.
- Supply: The supply curve represents the relationship between the price of a product and the quantity producers are willing to supply. Usually, as the price increases, the quantity supplied increases (law of supply), and as the price decreases, the quantity supplied decreases.
At Equilibrium:
- At equilibrium, the price is such that the quantity demanded (by consumers) is exactly equal to the quantity supplied (by producers).
- The market is in a state of balance, meaning there are no surpluses or shortages of the product. This is the point where the supply and demand curves intersect.
- If the price were above the equilibrium price, there would be excess supply (a surplus), as producers would want to supply more than consumers are willing to buy.
- If the price were below the equilibrium price, there would be excess demand (a shortage), as consumers would want to buy more than producers are willing to supply.
Summary on the relation between Price and Quantity, and supply and demand at Equilibrium
In summary, at equilibrium, the price and quantity are determined by the market forces of supply and demand. The price is set in such a way that the quantity demanded equals the quantity supplied, resulting in a balanced market. Any deviation from this equilibrium leads to market forces pushing prices and quantities back towards the equilibrium point. This concept is at the core of understanding how markets function in economics.
Algorithm, validation and source of knowledge
We made this Equilibrium Price and Quantity Calculator based on the direct supervision of Michael Slotkin. Michael Slotkin is a professor of economics who has in-depth knowledge of price, quantity, supply and demand at the equilibrium stage. Moreover, he also knows different aspects of economics. He validated the formula and algorithm of this calculator. Also, he checked and validated the content present on this webpage.
We have also reviewed several research papers to create this Equilibrium Price and Quantity Calculator. Some of them are given below:

